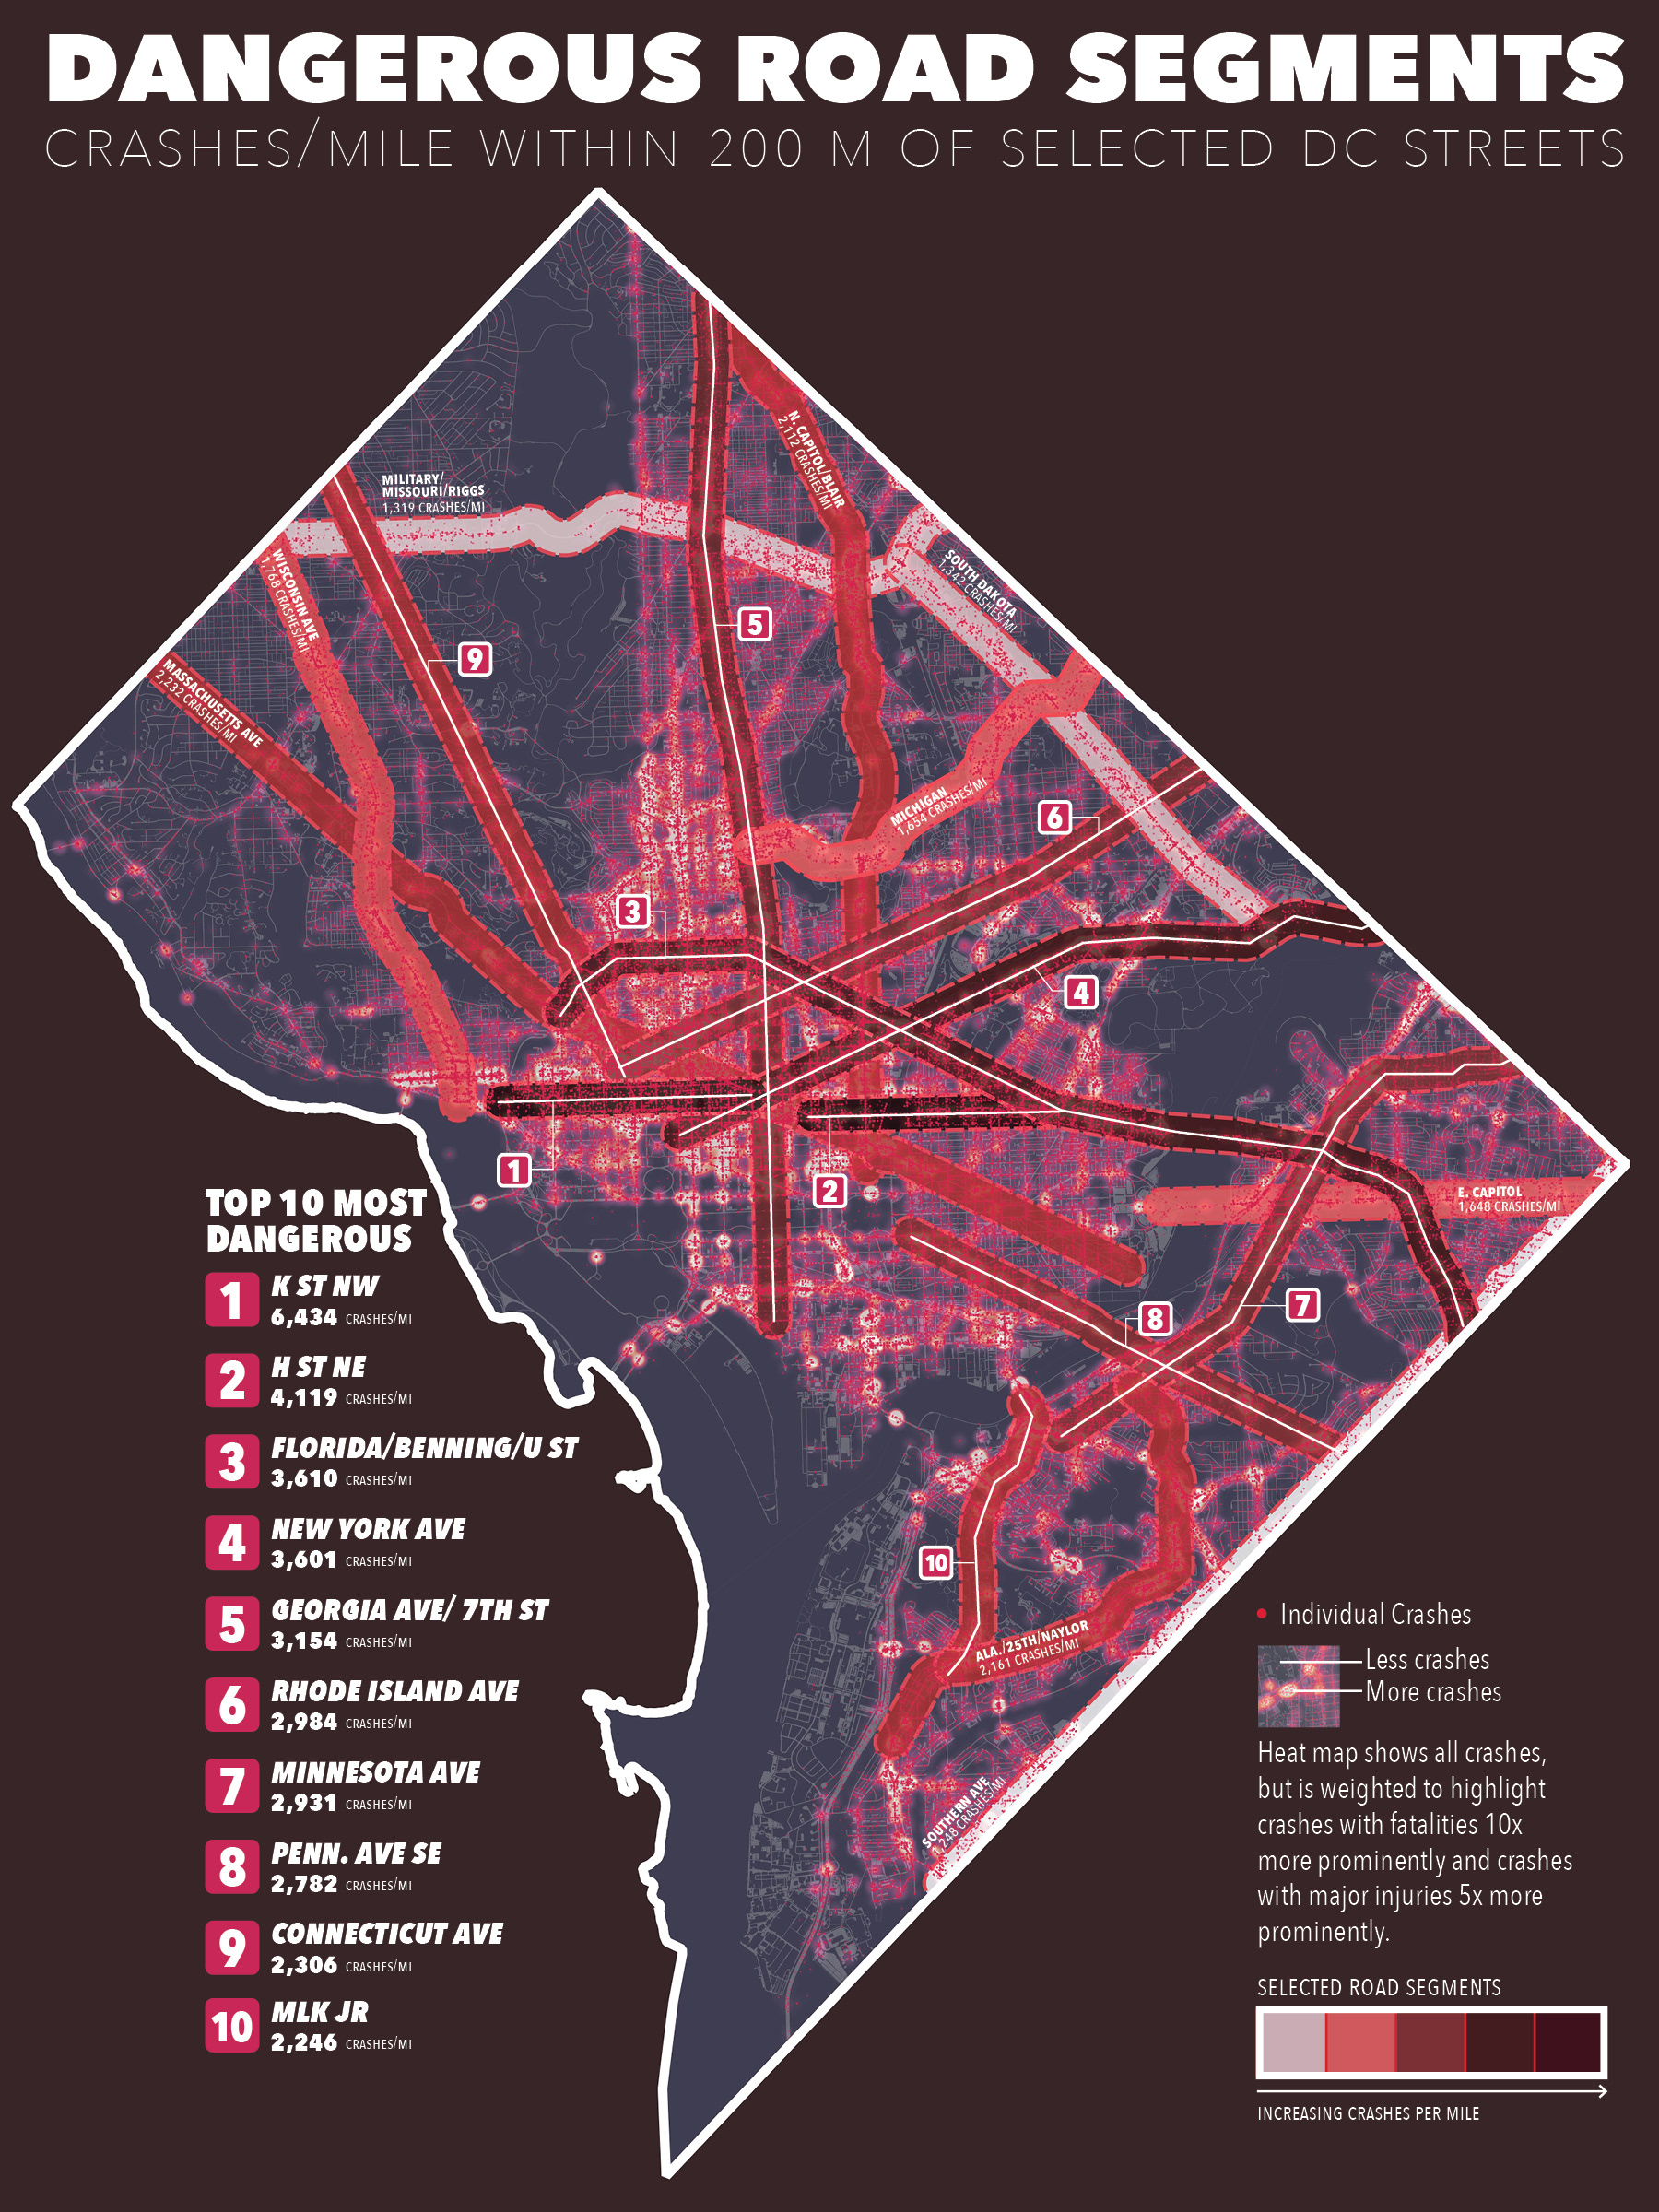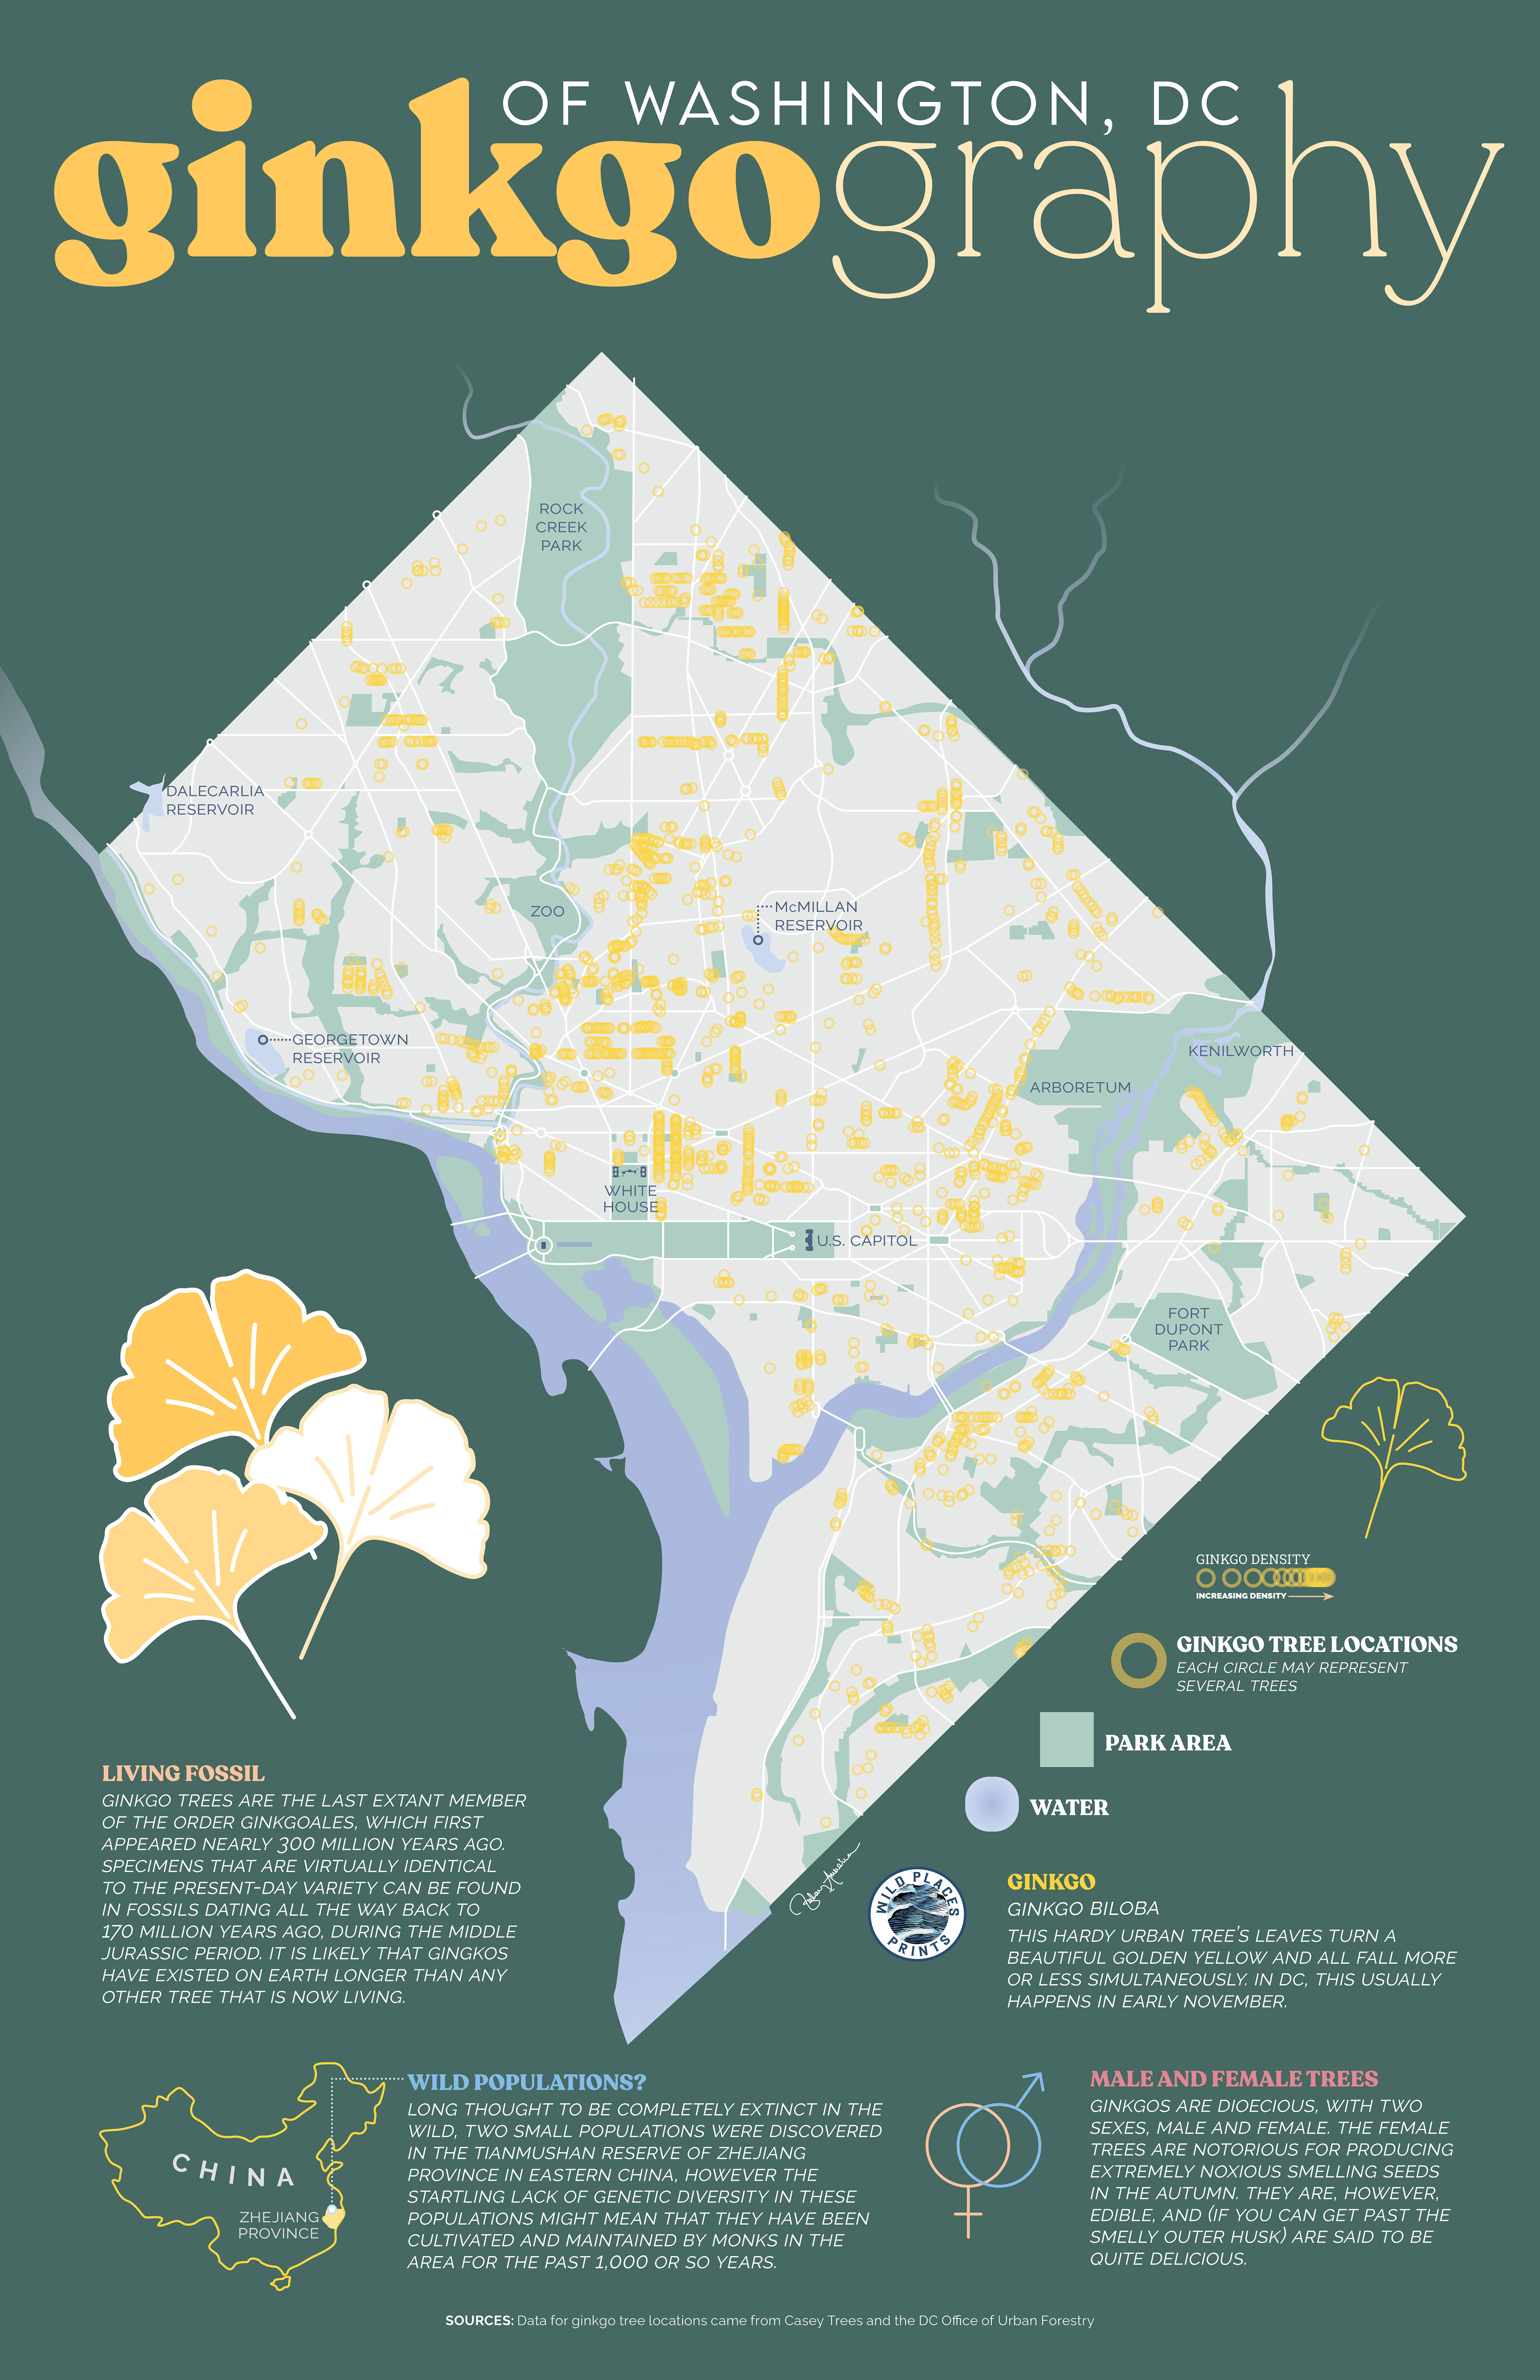


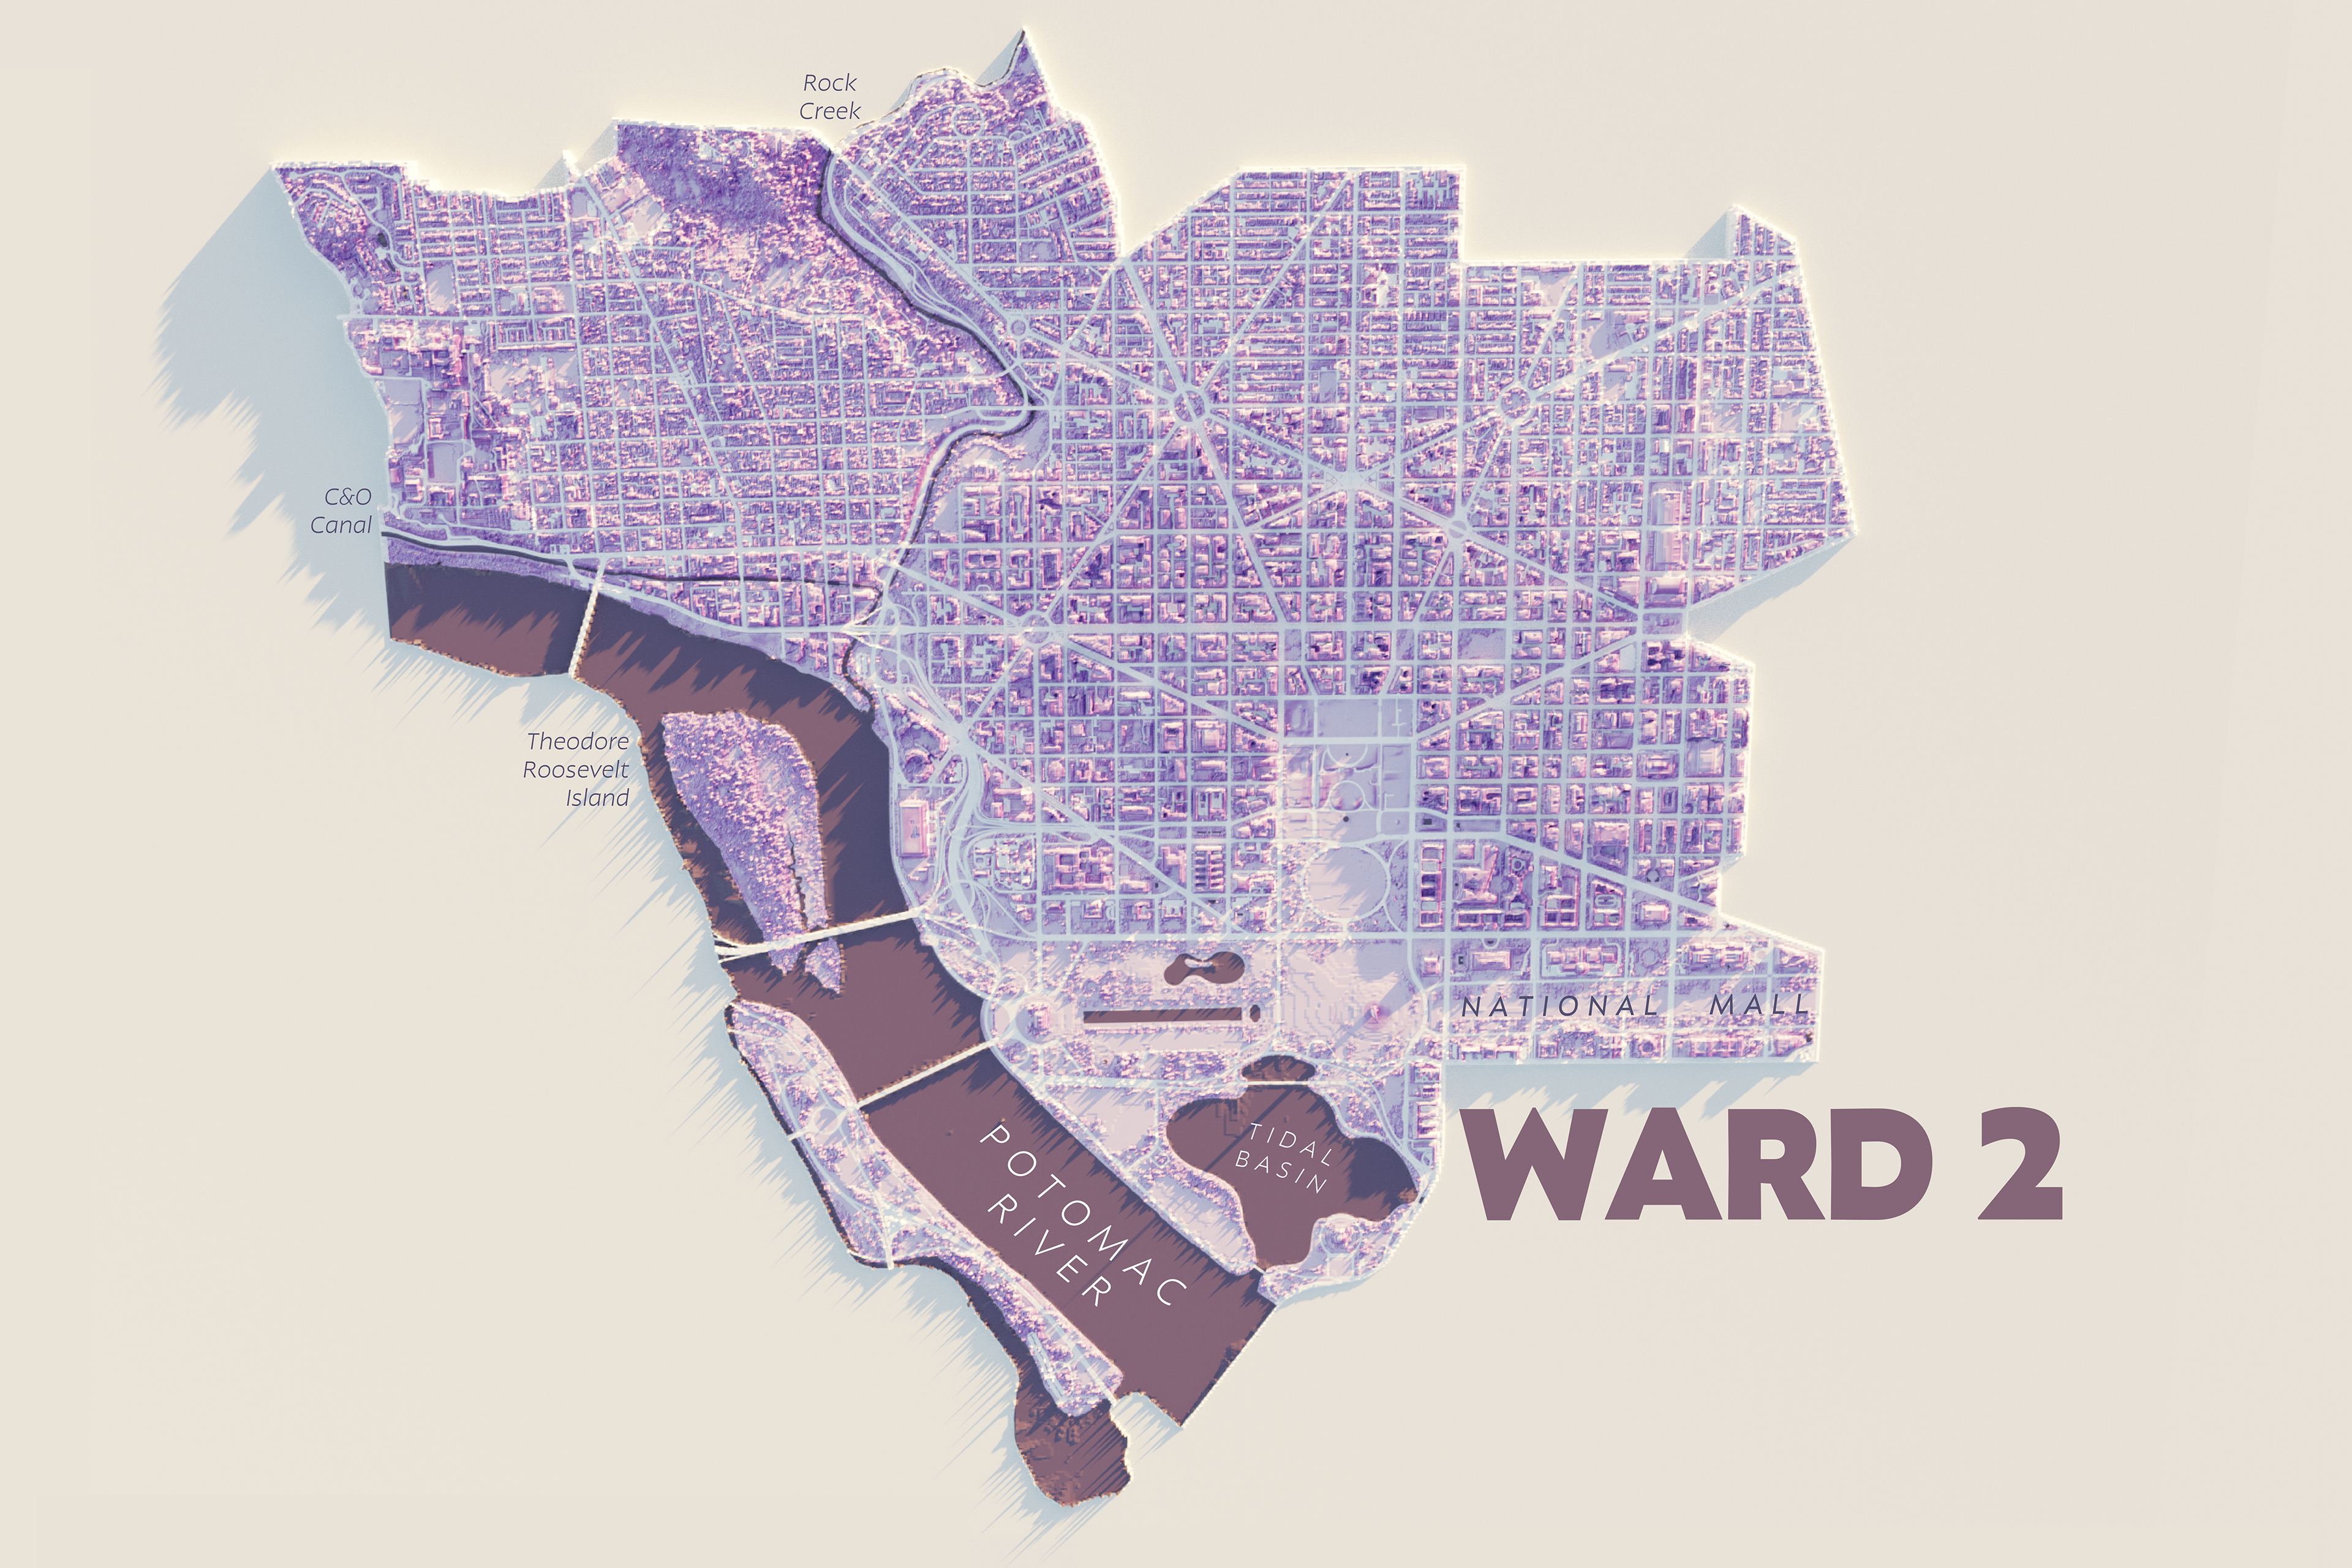
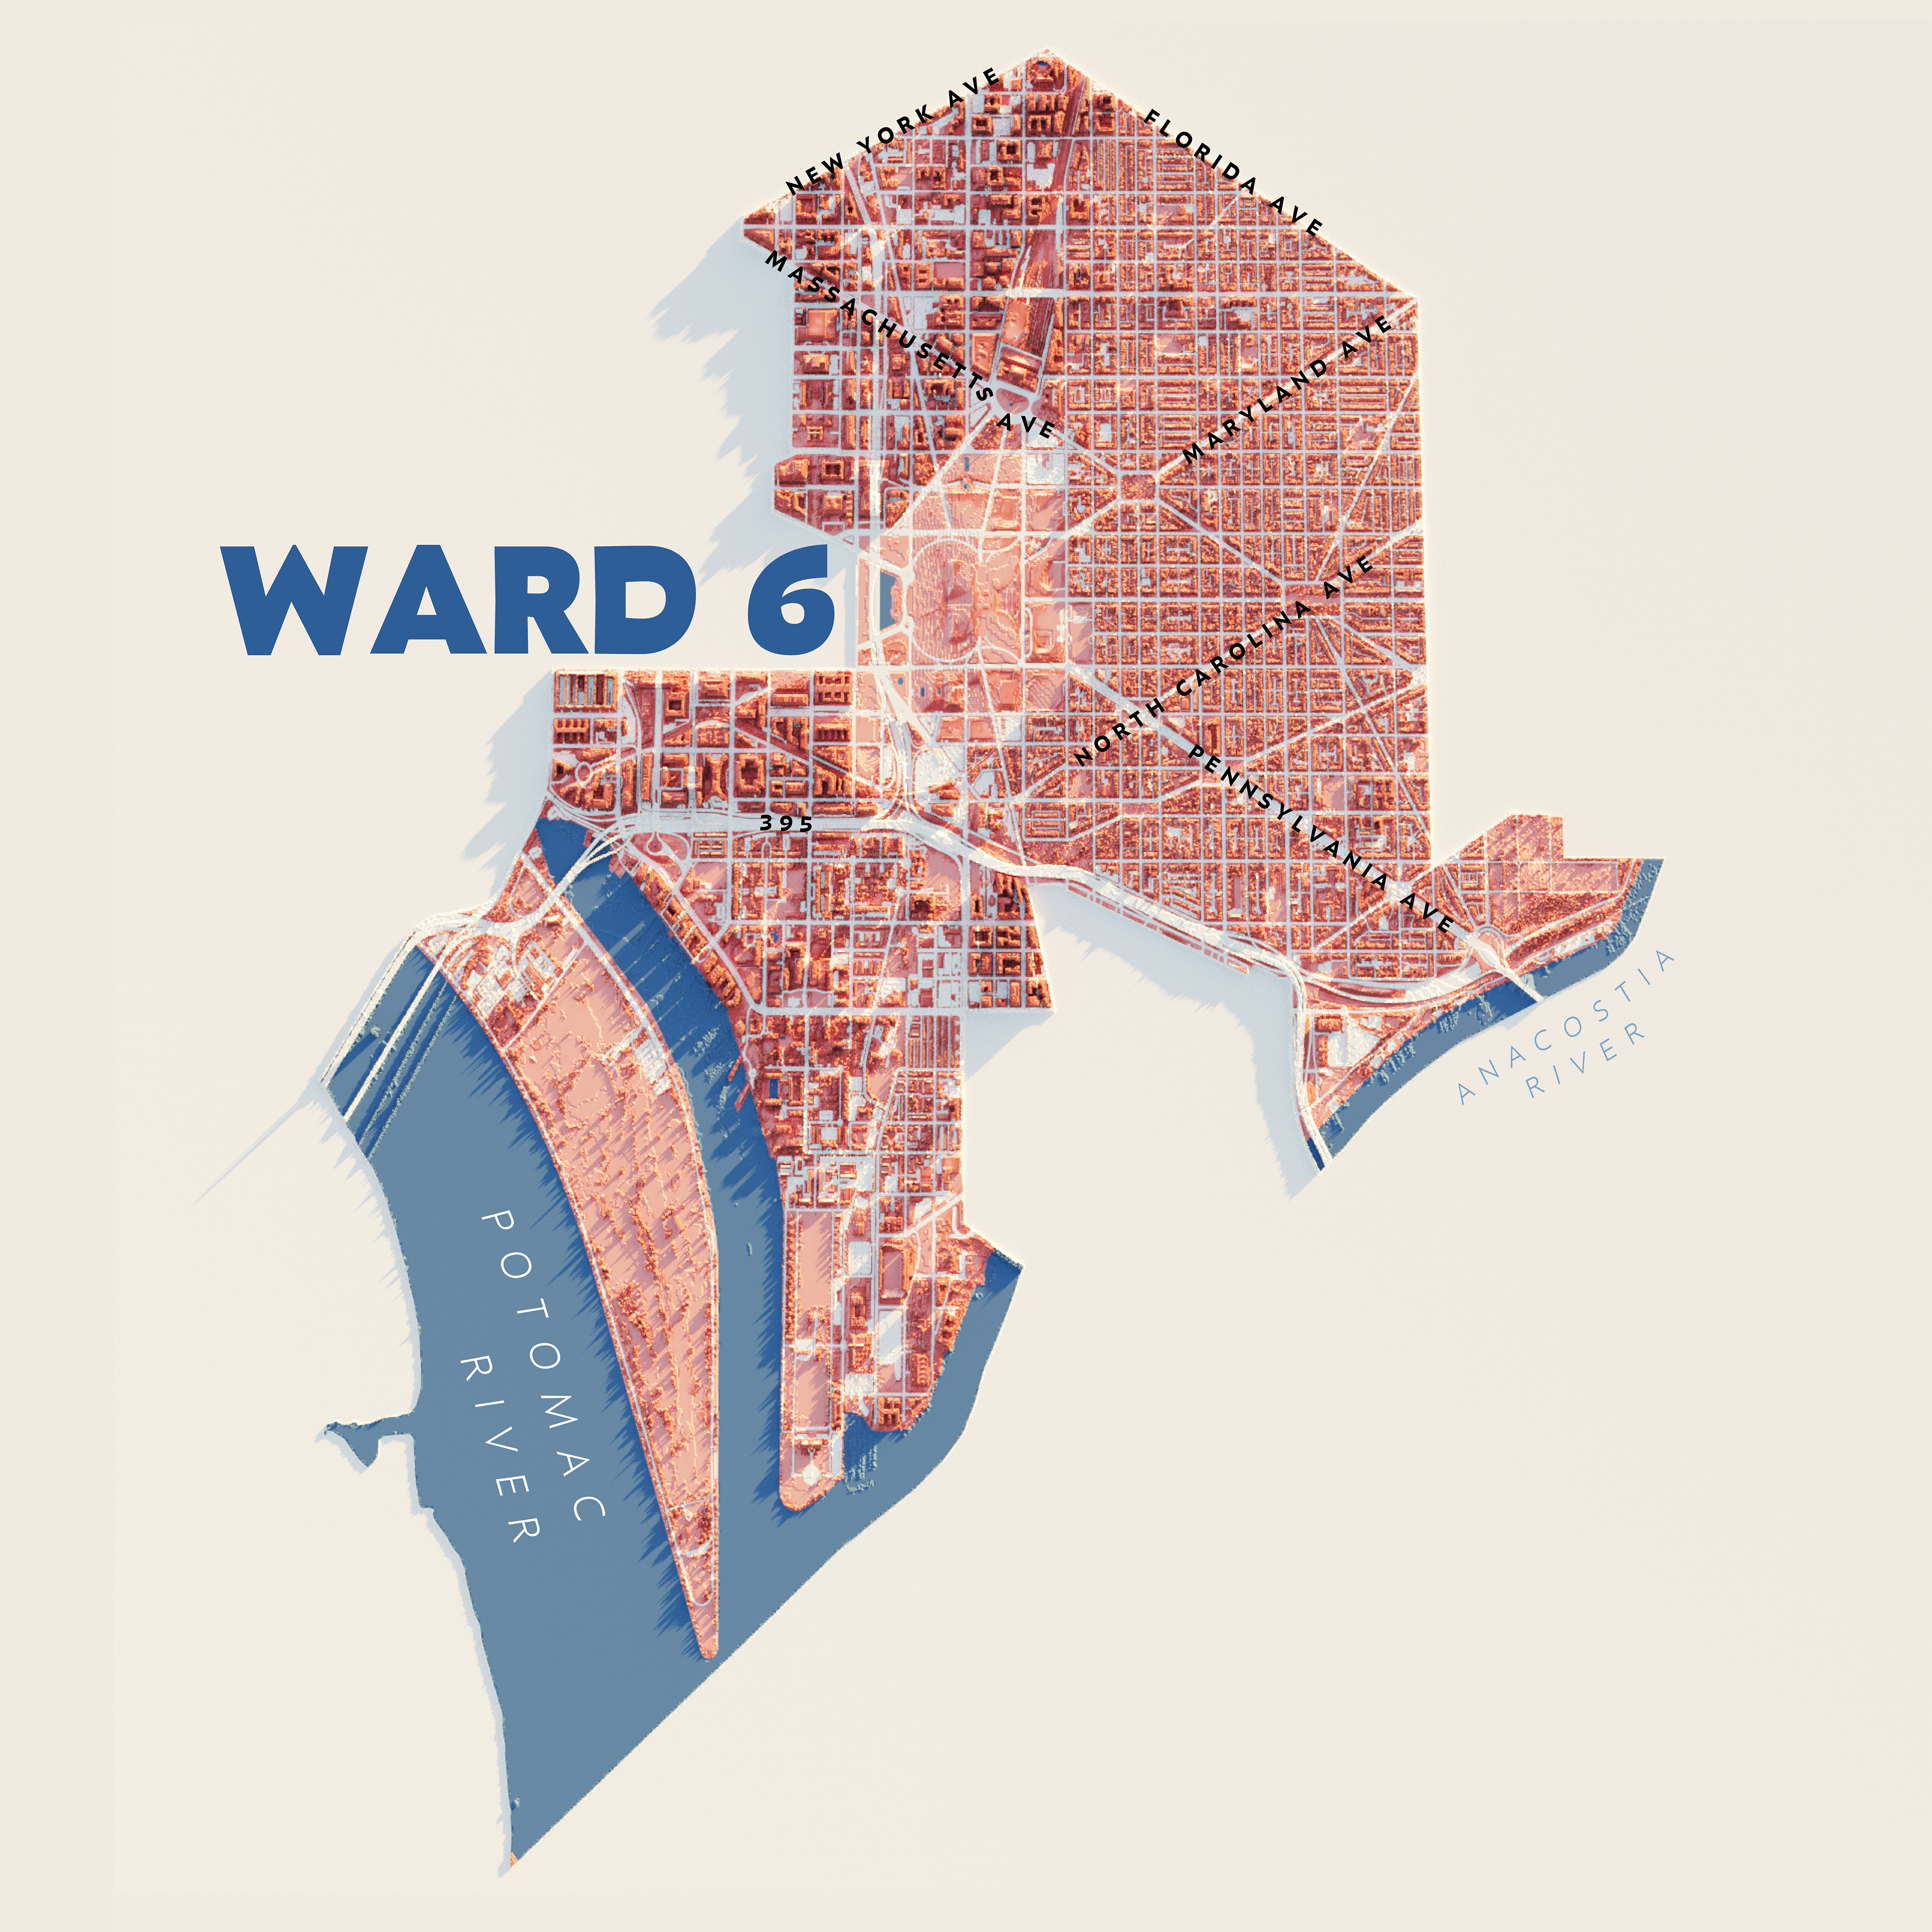
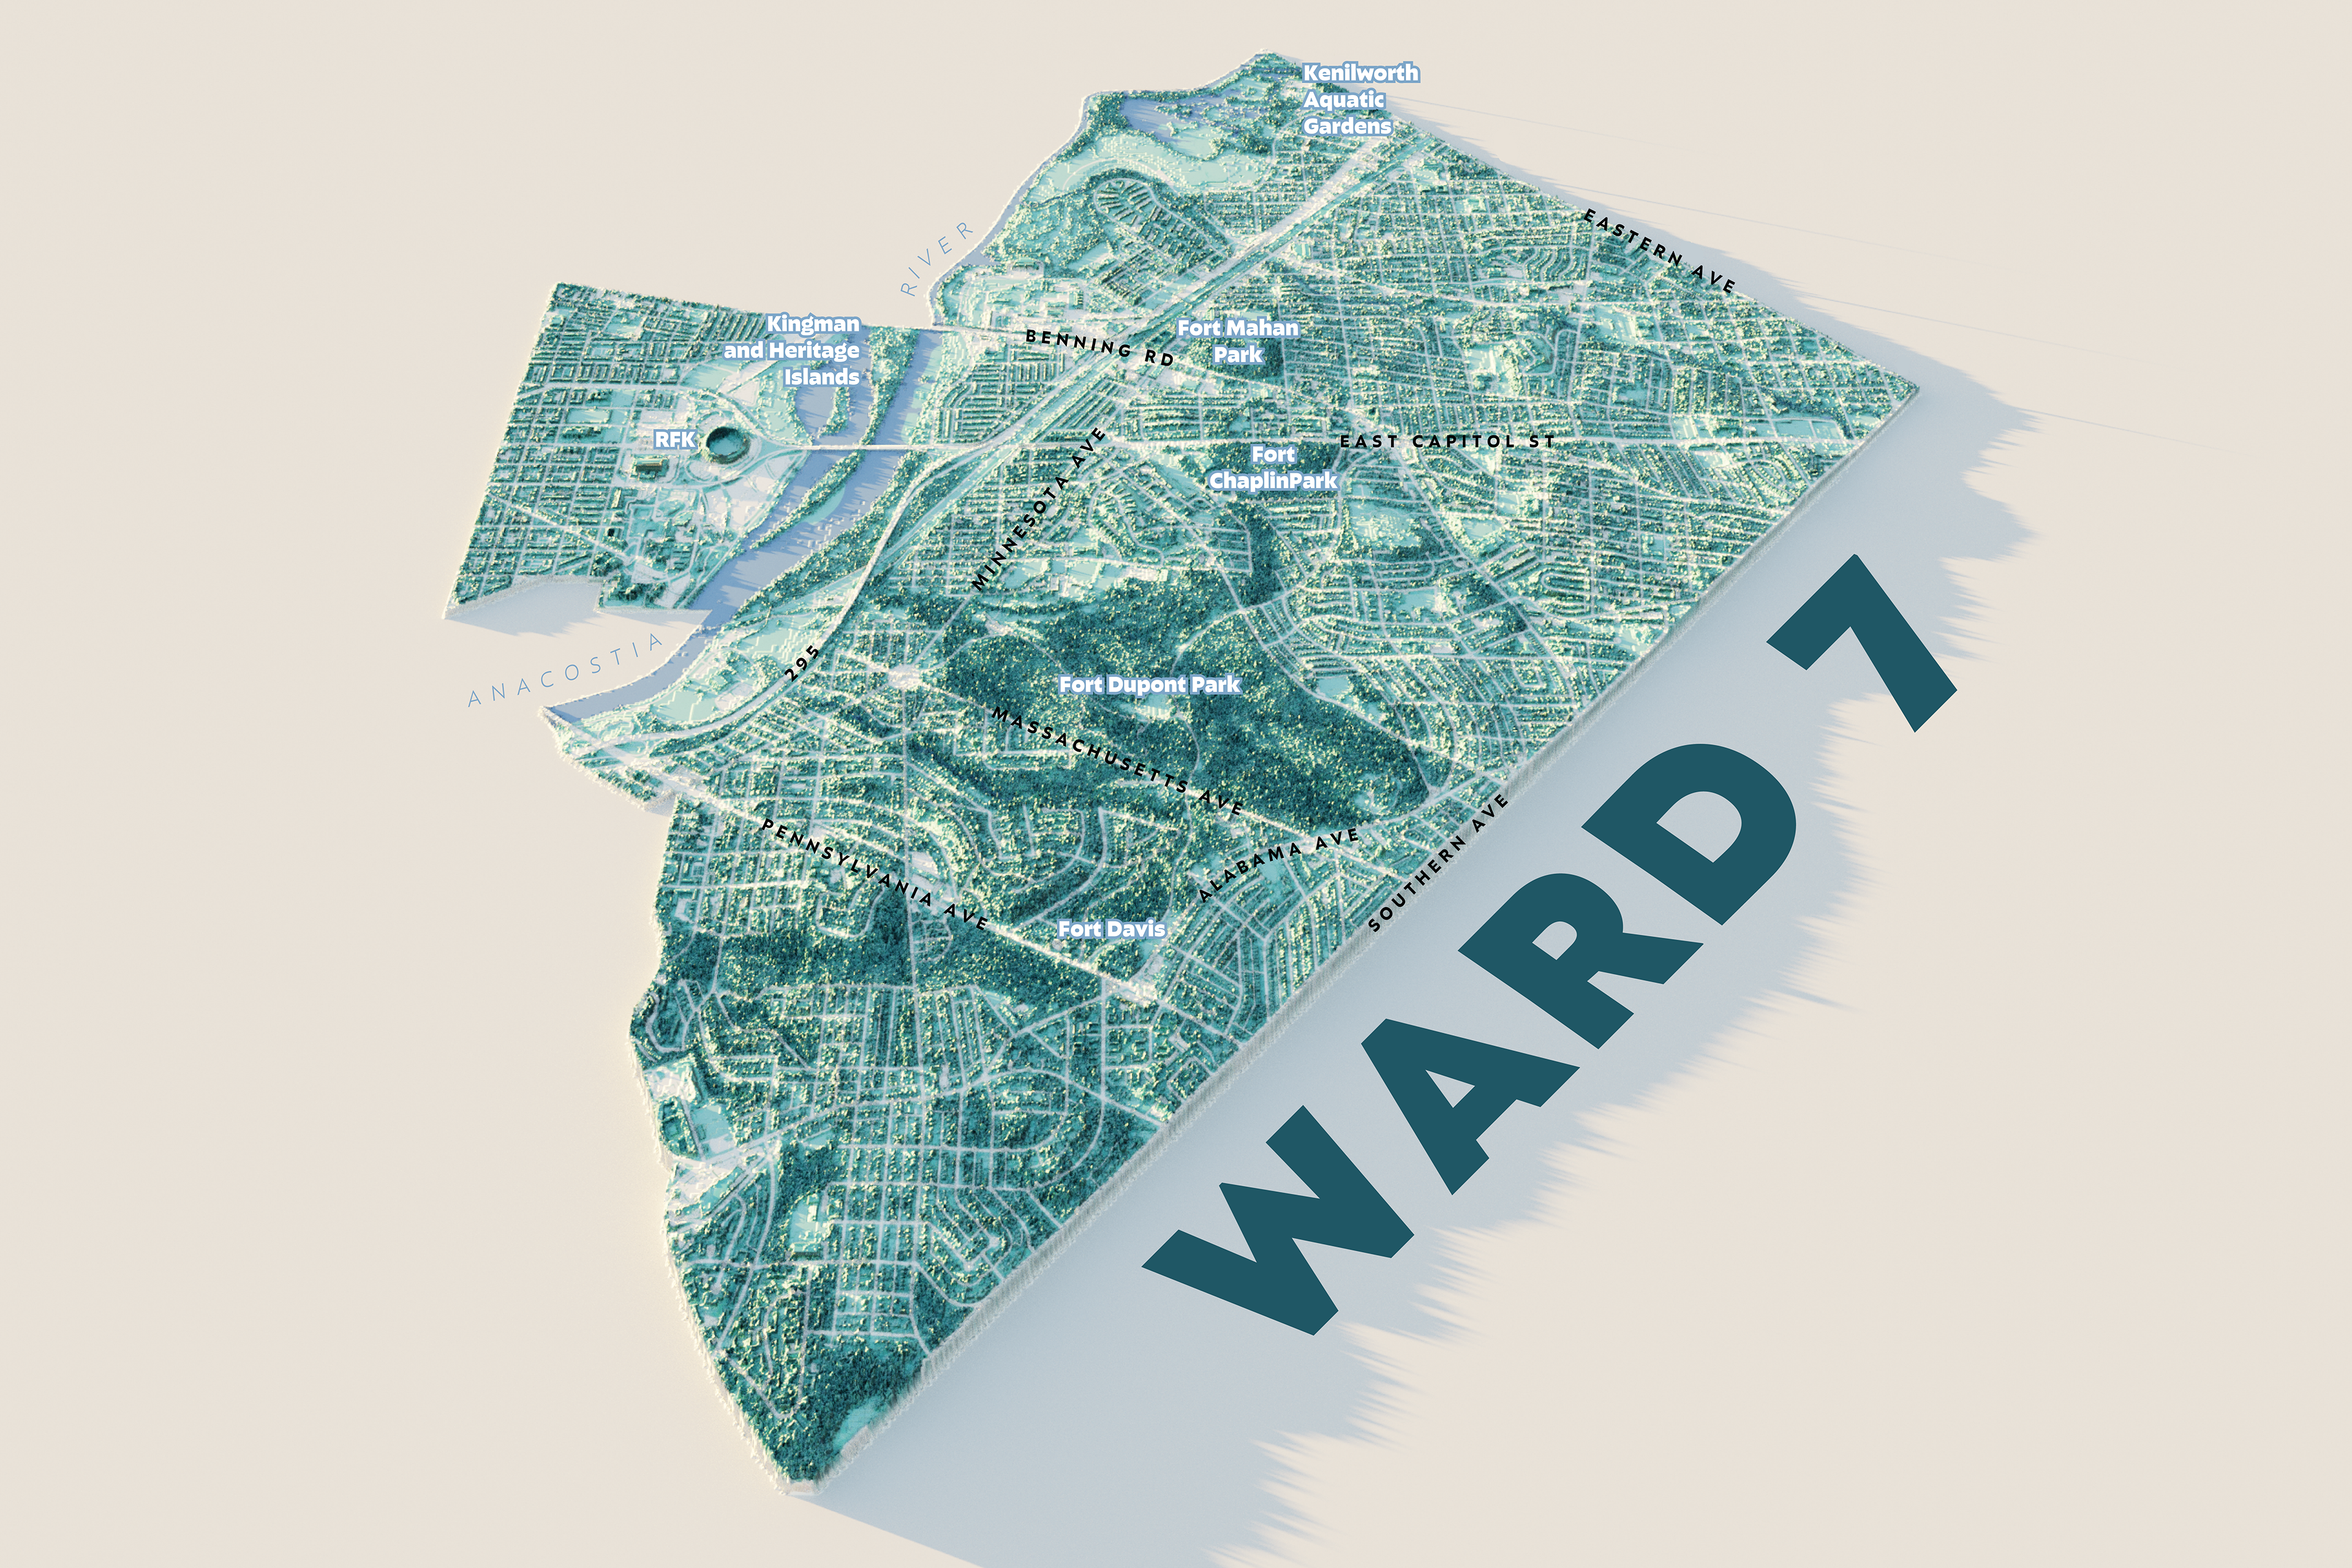


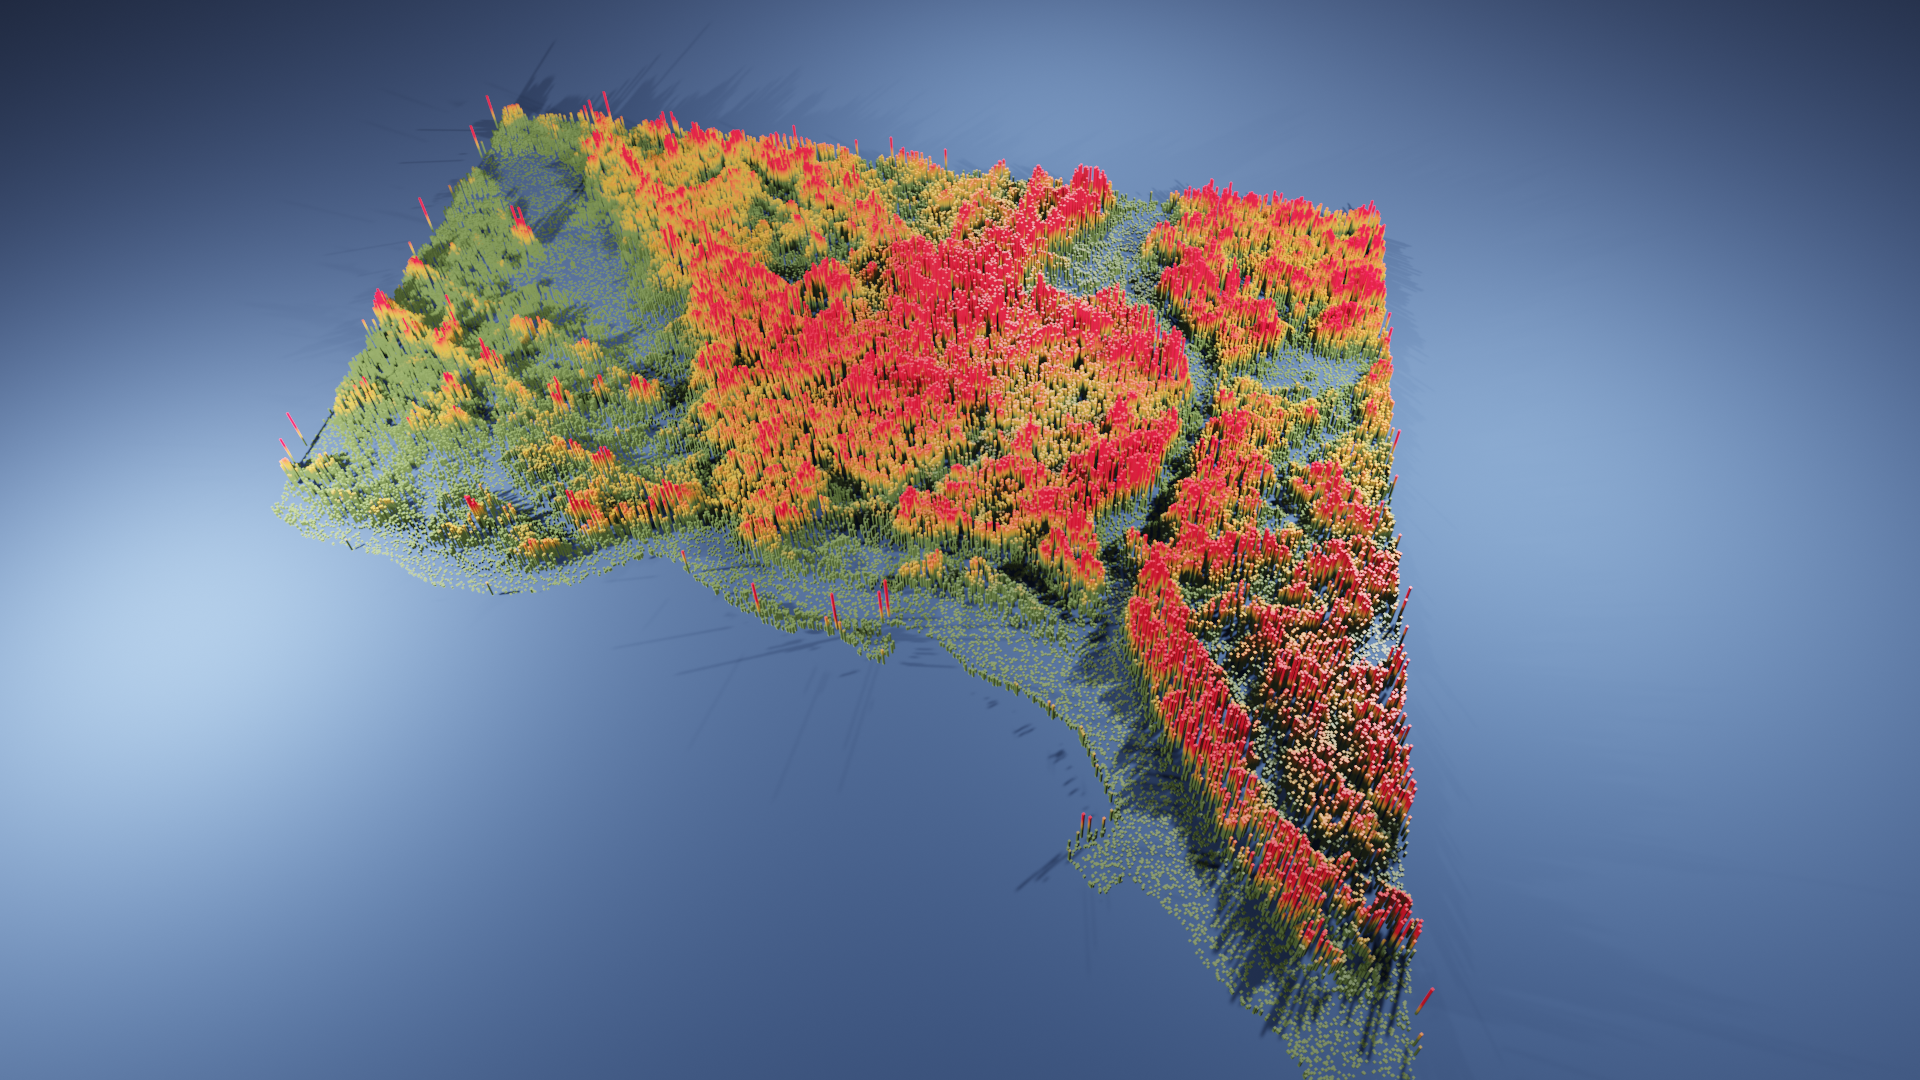
3D map of DC's land surface temperature using satellite data from July 2018, coolest temperatures in green, hottest in red. Temperatures vary from around 70 degrees F to over 116. On the hot end, you can clearly make out large avenues, highways, parking lots, rail lines and industrial zones. On the cool end, you can see almost the exact flow of rivers and the precise park boundaries of several large and small parks. Additionally, you can see the huge disparities between wealthy parts of Wards 2, 4, and 3 especially, and most of the rest of DC.